When I should be doing statistics homework or working on coding projects, I often find myself browsing reddit.com/r/nba. An interesting piece of information I saw was that despite having a career average of 27 points, 7 rebounds, and 7 assists, LeBron James has never posted that exact statline in a game. I thought this was peculiar and set out to apply my statistics and programming knowledge to find the probability of this seemingly strange phenomenon.
I started by scraping data from basketball-reference.com. I collected James' statline from each of his 1143 regular season games across 15 seasons. My next decision was how I wanted to model the data. I had two probability distributions in mind to model the stats with, the Poisson distribution and the Gaussian (normal) distribution. The Poisson distribution was attractive to me at first becasue it is a discrete distribution meaning that it is defined over integers rather than real numbers. This is a desirable quality becasue scoring in basketball is discrete so it would allow for more straightforward calculations.
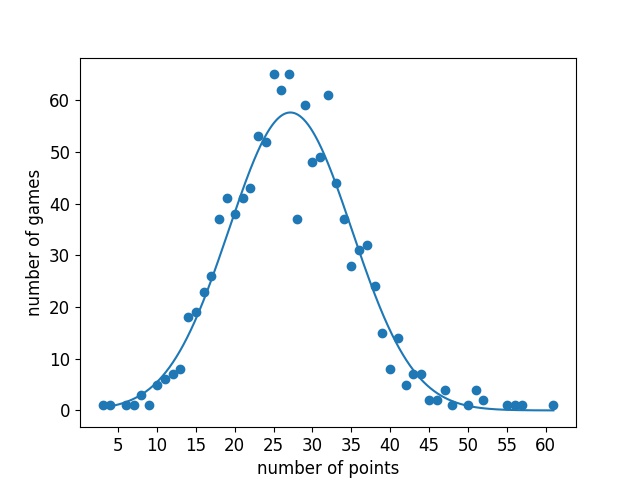
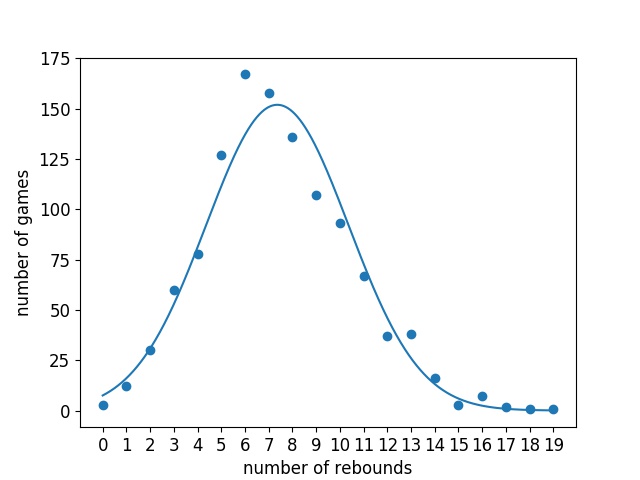
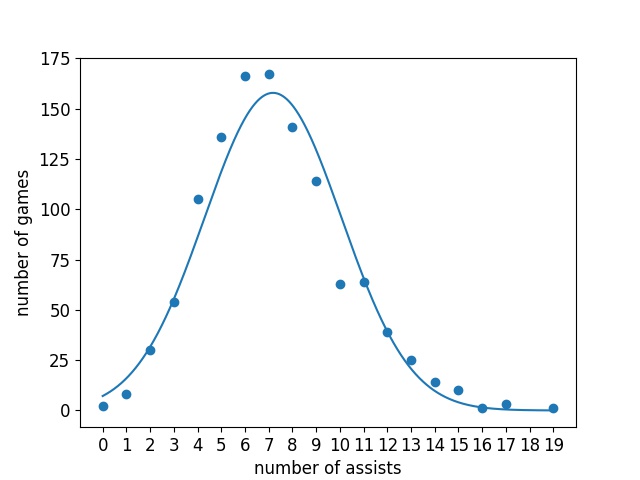
In order to decide how to proceed, I looked at the data. First I calculated summary statistics for points, rebounds and assists. $$ \begin{array} {|c|c|c|c|} \hline \text{statistic} & \text{mean} & \text{variance} & \text{standard deviation} \\ \hline \text{points} & 27.15 & 62.58 & 7.91 \\ \text{rebounds} & 7.36 & 9.01 & 3.00 \\ \text{assists} & 7.18 & 8.35 & 2.89 \\ \hline \end{array} $$ What these numbers told me is that the Poisson distribution is probably not appropriate to model this data. This is because of a property of the Poisson distribution where the mean is equal to the variance. However all three of these statistics violate that property, especially points. Next I decided to see how well the data fit a Gaussian distribution. To do this I plotted the various point, rebound and assist numbers along with the number of games LeBron has completed with exactly that number. On the same axis I plotted a continuous normal distribution with the mean and variance of the corresponding stat estimated from the data.
I was very surprised at how well the Gaussians fit the actual data. For all three statistics there is a clear bell curve shape. There are a couple of artifacts I think are worth mentioning however. First, for both rebounds and assists, there appears to be a slight shift mismatch. In the high probability density regions the estimated Gaussian is slightly right shifted compared to the data. I suspect this is a result of nature of basketball statistics. What I mean by this is that you cannot have negative statistics. For example, while his average rebounds may be 7, LeBron is perfectly capable of getting more than 14 rebounds, but it is impossible to get less than 0. This skews the distribution to the right meaning that the mean is greater than the median. The other irregularity is with the points distribution. There is one outlier point and it is right near the mean of the distribution. LeBron has only had 37 games where he has scored exactly 28 points, this is highly unexpected given that he has 65 games with 27, and 59 games with 29. I do not know what the cause of this is, and it could probably be the subject of an entire article, but I won't attempt to go into it here. Outliers are an unavoidable part of data analysis and the resulting Gaussian still fits the data very well so I'm not going to do anything about it, I just thought it was worth mentioning.
Now for the actual calculation of the probabilities. My first idea was to use the three estimated Gaussians above to get estimates of the probabilities of scoring 27 points, grabbing 7 rebounds, and dishing out 7 assists seperately, and multiplying them find the joint probability of all three events occuring in the same game. However this makes an assumption which I was not sure holds. That assumes that the three stats are independent. I have reason to suspect that they are not infact independent because all three depend on shared factors such as LeBron's physical and mental readiness that night, how his teammates are performing and the level of the team he is playing. Any of these factors could cause points, rebounds and assists to be correlated (or anticorrelated).
To get an idea of the interactions between these three statistics I calculated the covariance matrix using numpy. This gives the pairwise variances between the variables. $$ \begin{array} {|c|c|c|c|} \hline & \text{points} & \text{rebounds} & \text{assists} \\ \text{points} & 62.58 & 3.56 & -0.68 \\ \text{rebounds} & 3.56 & 9.01 & 1.59 \\ \text{assists} & -0.68 & 1.59 & 8.35 \\ \hline \end{array} $$ On the diagnal we see the individual variances I calculated earlier. The fact that the off diagnal entries are not 0 means that the statistics are not independent. In fact 3.56 being positive shows a positive correlation between points and rebounds which makes sense for the reasons mentioned above. Also interesting is the slight negative correlation between points and assists. This can be explained by the fact that points and rebounds are in direct competition with each other each posession as it is not possible to both score and assist in the same posesstion.
With the means and covariance matrix calculated, I can construct a multivariate normal distribution with the density function defined below. $$ f_{\textbf{X}}(x_p, x_r, x_a) = \frac{\text{exp}(-\frac{1}{2}(\textbf{x} - \bf{\mu})^T\Sigma^{-1}(\textbf{x}-\bf{\mu}))}{\sqrt{(2\pi)^k\lvert\Sigma\rvert}} $$ Where $\mu$ is the vector of the means of the stats and $\Sigma$ is the covariance matrix. However, a probability density function is not directly defined over specific values but rather it gives probabilities when integrated over ranges. This means that it is not as simple as calculating $f_{\textbf{X}}(27, 7, 7)$. Instead we need to integrate the density function over a range. The common method for discretizing a normal distribution for integers is to subtract and add 0.5 to the integer in question. So to calculate the probabibility of a 27/7/7 game I evaluate the following. $$ \textbf{P}(27,7,7) \approx \int_{26.5}^{27.5}\int_{6.5}^{7.5}\int_{6.5}^{7.5} \frac{\text{exp}(-\frac{1}{2}(\textbf{x} - \bf{\mu})^T\Sigma^{-1}(\textbf{x}-\bf{\mu}))}{\sqrt{(2\pi)^k\lvert\Sigma\rvert}}dx_adx_rdx_p $$ I used scipy.stats.mvn, a statistical software package to evaluate this integral. The value came out to be $0.000936$ (as opposed to $0.000946$ from the explicitly evaluating the density function at 27/7/7).
So now that we have $\textbf{P}(27,7,7)$, we can solve for $\textbf{P}(\overline{27,7,7})$. That is, the probability that in any given game LeBron James will not score exactly 27/7/7. This is simply $1 - 0.000936 = 0.999064$. So to calculate the probability that LeBron James would never achieve this score can be used by raising this value to the power of the number of games he has played. This makes the additional assumption that scoring, rebounding and assisting are independent from game to game. This assumption is likely violated as well but I don't really think there is an easy way to correct for this and the violation is not as eggregious as the interaction between the points, assists and rebounds themselves.
Using all of the assumptions, distributions, and calculations we can calculate the probability that LeBron James would never post a 27/7/7 in 1143 games is $0.999064^{1143} = 0.34288882781$. Meaning that there was only a 34.29% chance that LeBron would go this far without getting that exact stat. While this is less than 50% and it is more likely that it would happen than that it wouldn't, 34% really isn't that small. Nobody is really surprised when someone rolls a die and the result is less than 3, and that even is statistically less likely than this one.
In conclusion, even though the sample size is quite large, the high dimensionality and large value space make it so that it really isn't that surprising that LeBron James has not recorded a single 27/7/7. However I would like to point out that these calculations are based on a series of approximations and violated assumptions so they should really be taken with a grain of salt.
All the code used in this project is available here. If you have questions, comments, or suggestions you can email me at  .
.